
$KKR is too cheap
KKR (disclosure: long) probably needs no introduction. The company is one of the original private equity firms and will forever be remembered for their role in the RJR Nabisco buyout at the center of Barbarians at the Gate. Today, it is one of the largest investment managers on the planet with $195B in assets under management (AUM) as of YE2018. Despite their size and fame (infamy?), I believe KKR is significantly undervalued at today's price of ~$23/share. I'm not going to go through a long overview of KKR because I would guess just about everyone who reads this will have some familiarity with the asset management business and the economics behind it. In fact, this is a very long post with (I think) a lot of good points and unique analysis / angles (particularly towards the end).... but if you want a tl;dr version of this post, here it is: at their 2018 investor day, KKR presented the slide below that suggested their fair value was "at least $40 per share". I don't agree with all of their assumptions, but directionally I think that slide is 100% accurate: fair value for KKR is way higher than today's ~$23/share price.

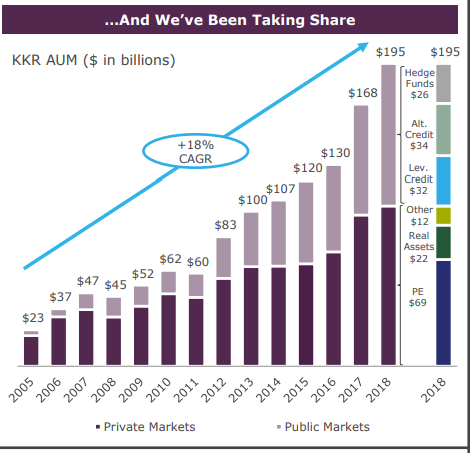
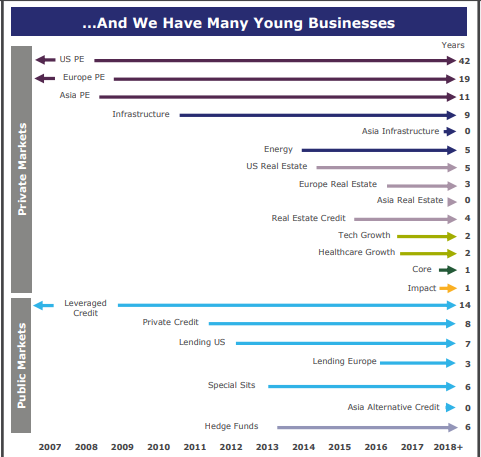
That out the way, a (very brief) overview. KKR is an alternative asset manager best known for their private equity business (which they launched >40 years ago). Today, however, KKR is much more than a private equity business; they manage almost $200B spread throughout a variety of global strategies (liquid credit, real estate, hedge funds, etc.). (slides below from KKR's March 2019 investor tear sheet)
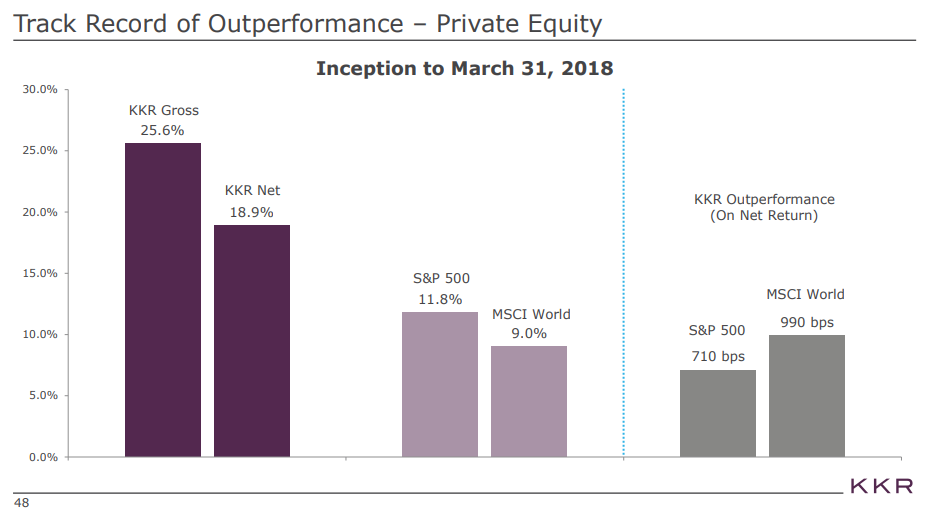
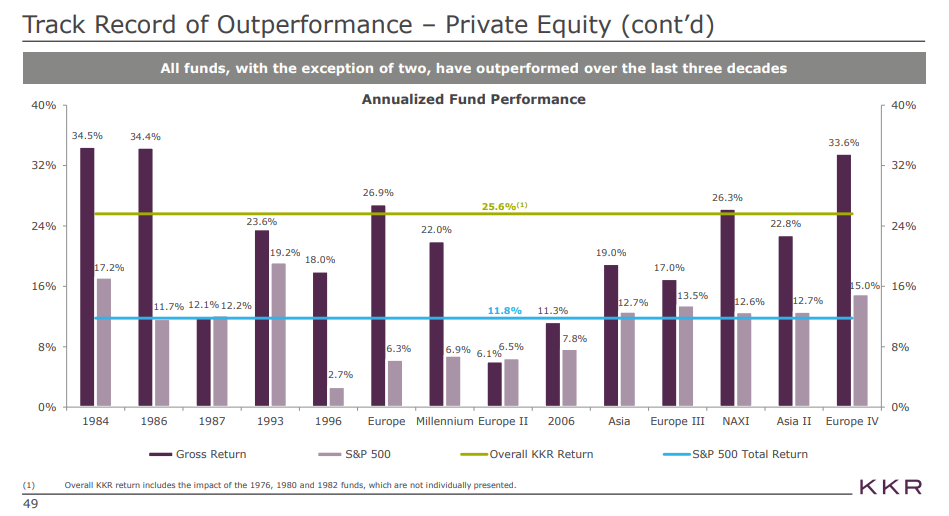
The alternative asset management business is a simple one. The manager raises a fund (a bunch of money) from a variety of investors ("LPs"; in KKR's case, institutional investors like pension funds and endowments). The manager (the "GP"; in this case, KKR) then invests that fund in whatever strategy they raised the money for (Asian private equity, European direct lending, etc.). While the fund is operating, the manager generally takes a fixed management fee (often 2% of the fund/year) and an incentive fee (generally 20% of profits over a specific hurdle rate). As the investments mature or the fund approaches the end of its life (generally 7-10 years for private equity), the fund returns the money to LPs. In general, the returns from this model have been pretty substantial for both the GPs and the LPs; the slides below are from KKR's July 2018 investor day and shows the performance of KKR's PE funds versus various indices.
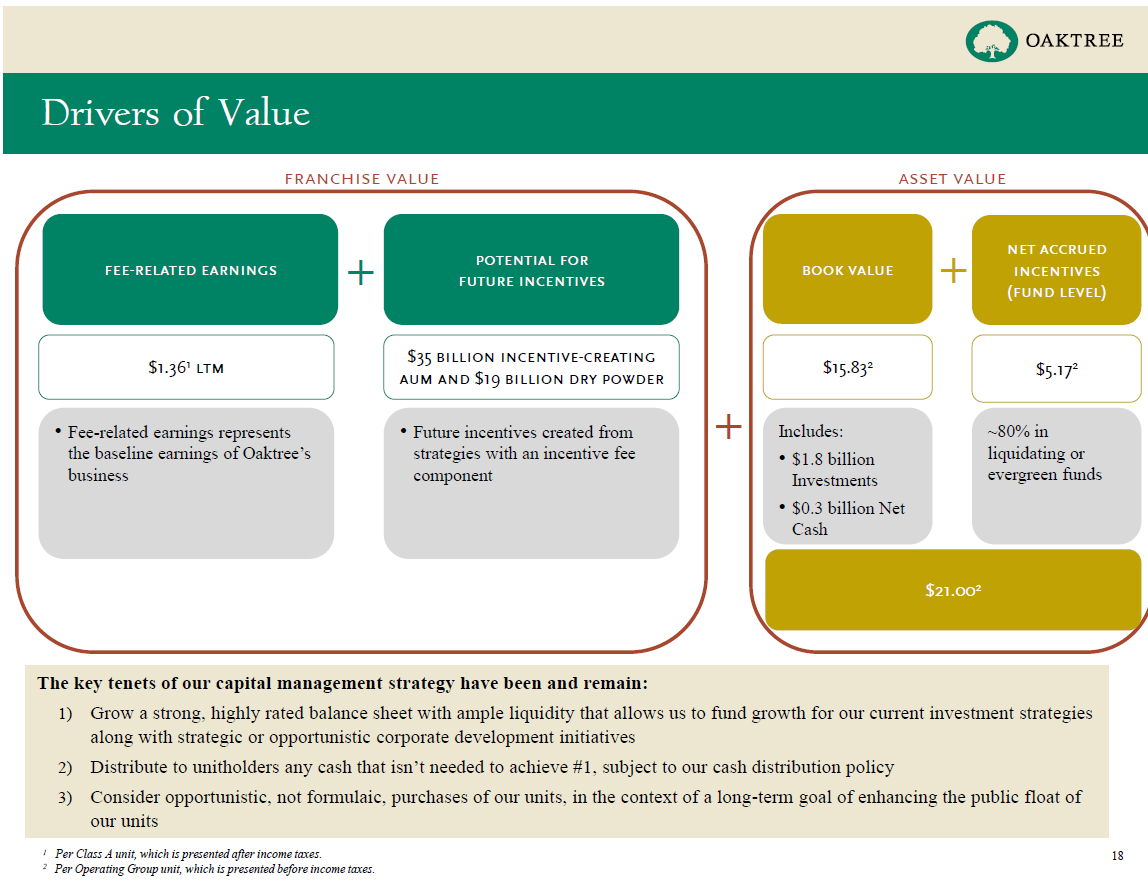
When you buy KKR's stock (or any other alternative asset manager like BX, APO, etc.), you are effectively buying two things: a stake in their GP, and the firm's "balance sheet" (the firm's net cash and investments, generally consisting of investment the firm has made into its underlying funds). The value of the GP comes from the GP's income stream: the management fees the fund charges its LPs and the incentive fees it realizes for making profitable investments (both net of whatever the fund pays their employees), while the value of the firm's balance sheet comes from increasing the value of that cash / investment over time. That means KKR is generally valued best using a sum of the parts valuation with an income multiple on their fee stream and a book value multiple on their investments. Note that I'm not alone in thinking that KKR (or any asset manager) is best valued by separating their asset management earnings stream from their balance sheet investments. Almost every asset manager thinks similarly and publishes the information to help investors value them like that. For example, below is a slide from Oaktree's (OAK) Q4'18 investor presentation that suggests investors value them exactly how I have suggested above.
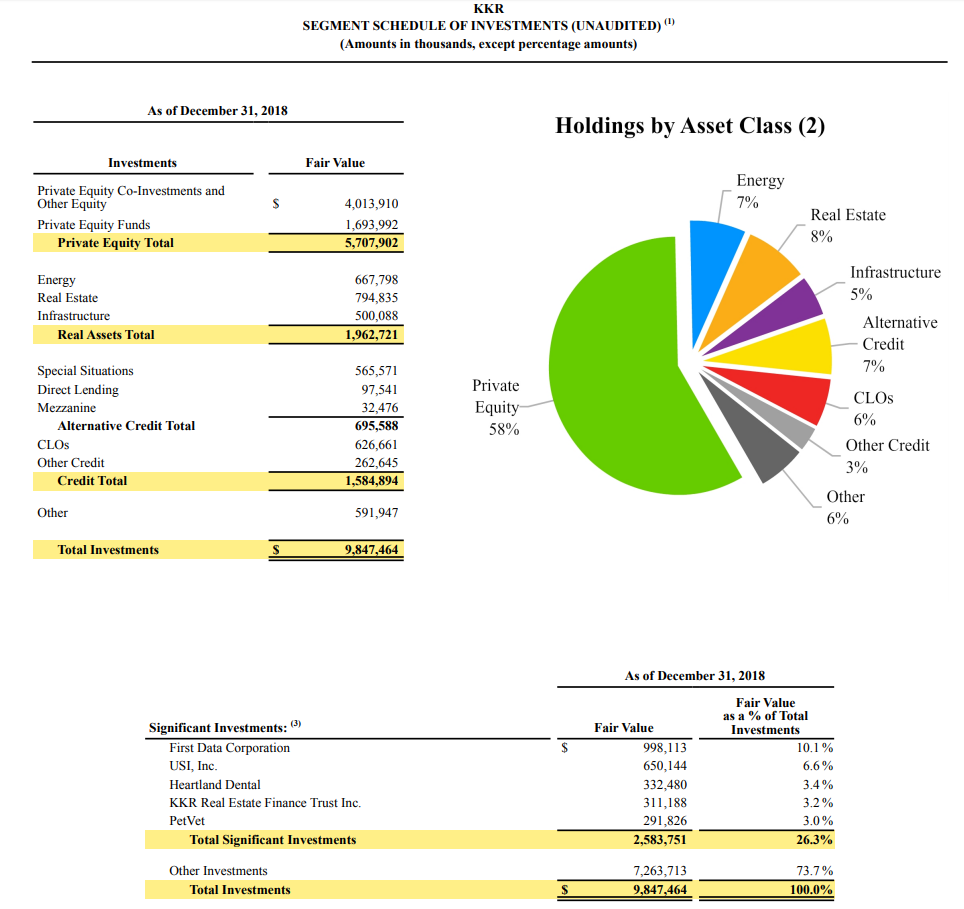
Let's start by valuing KKR's investments. At 12/31/18, KKR's investments were valued at $15.57/share. You can see a breakout of how the investments were structured below; the majority of KKR's investments were in private equity but there's also a nice bit in several other asset classes.
So KKR's book value is worth $15.57, right? I think that's probably too conservative; markets are up significantly since year end (as I write this, the Russell 2000 is up ~15% YTD), and given the relatively leveraged nature of most private equity investments I would guess KKR's book is up a substantial amount as well. Of particular note is KKR's investment in First Data (FDC). FDC represented 10.1% of KKR's fair value at 12/31/18, but the stock has been on an absolute tear so far this year (in large part driven by their stock for stock merger with FISV). FDC was valued at ~$16.91/share at 12/31/18; today, FDC shares trade for ~$25.56. FDC's share gains alone would add about $0.60/share to KKR's book value (bringing book value to ~$16.18/share). So we know KKR's balance sheet is worth $15.57/share as of year end and likely significantly more currently given equity market moves / FDC's merger. The big question is how investors should value that stake. I've seen two schools of thought on this; let's call the two schools the bear school and the bull school.
The bear school contends that KKR (or any alternative asset manager) is basically a conglomerate, and any investments at a conglomerate deserve some type of discount, so you should apply a haircut to KKR's book value. If Liberty Sirius (LSXMA; disclosure: long) persistently trades at a ~30% discount to its NAV despite NAV consisting of a liquid stake in a publicly traded stock (so that it's NAV is incredibly easy to calculate / doesn't require any assumptions or valuations on management's end) and Liberty's strong track record of maximizing shareholder value, shouldn't KKR, whose book value is very illiquid and relies on management's input on valuations, trade at an even bigger discount?
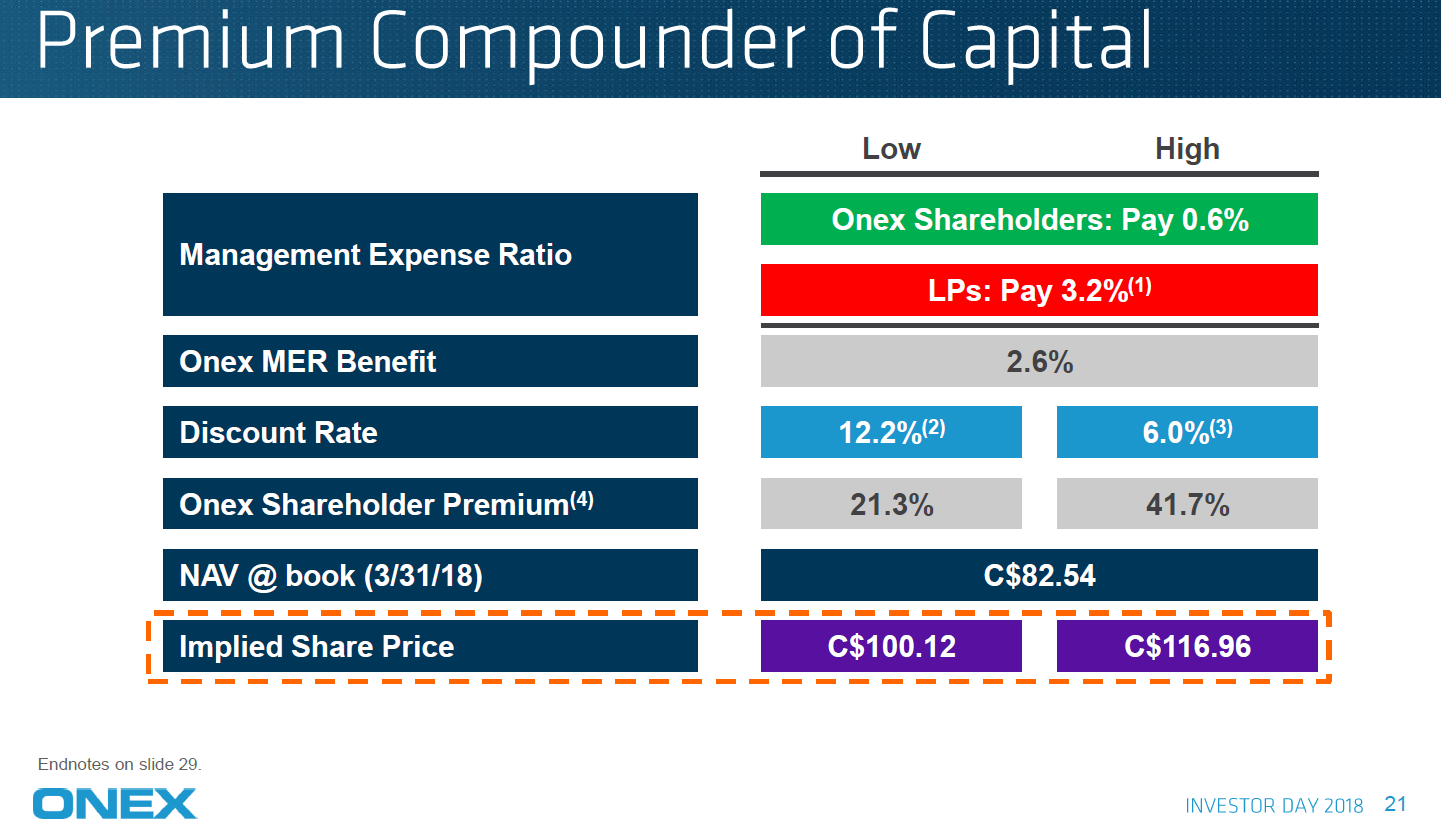
The bull school points out that KKR (or most other alternative asset managers) have an incredible track record, and most individual investors can't access KKR's funds given multi-million dollar minimum investments. By maintaining balance sheet investments, KKR shareholders can get access to those investments (which they otherwise wouldn't get) and benefit from KKR's investment skill. If KKR can grow book value by low double digits going forward (well below their historical private equity track record to account for investments in lower returning strategies like credit or some cash drag; KKR actually thinks they can grow book value to $63/share in 10 years though that's not purely from investment performance), then you could argue that KKR's investments should actually be valued at a premium to book value. Heck, we've seen LP stakes in private equity funds trade at premiums to NAV in the recent past, so shouldn't KKR's balance sheet (which not only gives investors access to KKR's investments, but does so without the fees associated with LP investments) trade at a significant premium to NAV? Investment manager ONEX (disclosure: long) made a similar argument at their 2018 investor day and suggested their book should trade at a 20-40% premium given the much lower fee structure associated with investing in ONEX through the asset manager versus through the LPs (note that ONEX's asset management franchise is no where close to as large as KKR's as most of Onex's capital is still internally managed so their management fees do not quite cover their operating expenses; that's why Onex shareholders "pay" 0.6% in the analysis below. KKR makes so much managing money externally that a similar slide would look ridiculous for them, so I show the slide only to highlight the deal minority shareholders get by buying the asset manager's stocks rather than to suggest KKR should be valued on anything similar to this analysis).
For now, let's just assume KKR's book value should be valued at 12/31/18 per share value of $15.57. Versus today's share price of ~$23/share, that implies KKR's book value makes up ~67% of KKR's current market price. Ok, so we've got our KKR book value settled out. Let's now value KKR's income streams. The income stream can effectively be broken into two different parts: the management fee stream, and the incentive fee stream. Each deserves substantially different multiples: the management fee is rather "locked in" and will be paid to KKR regardless of underlying fund performance, while the incentive fee stream is much more variable and depends on KKR realizing profits on their investments above whatever their hurdle rate is. So let's start by valuing KKR's management fee stream. KKR (and most other alternative asset managers) provide a "fee related earnings" (FRE) figure that is supposed to approximate their management fee stream (it's pre-tax segment earnings before performance income and investment income). In 2018, KKR did ~$1.1B in FRE, or ~$1.28/share. The big question is what multiple that earnings stream should go for? If you were to ask an industry insider, they would suggest FRE should go for a reasonably high multiple. Most of an alternative asset manager's capital is subject to long term locks (~10% of KKR's capital is "permanent" and 60% of it is locked up for 8+ years), and the management fee stream is reasonably predictable as it's not subject to performance (the term "annuity like" often gets thrown around when referring to the management fee stream, which is a bit aggressive but is probably directionally correct).

KKR has consistently suggested that their FRE should be valued at ~20x; they're joined in this view by a variety of peers
Brookfield (BAM; disclosure: long) values their fee related earnings at 20x "for purposes of measuring value creation and business planning" (see p. 3 of their 2017 AR). (Note that BAM's FRE definition includes taxes while most other definitions exclude them; however, I believe BAM's tax rate is extremely low so this is not a crazy difference).
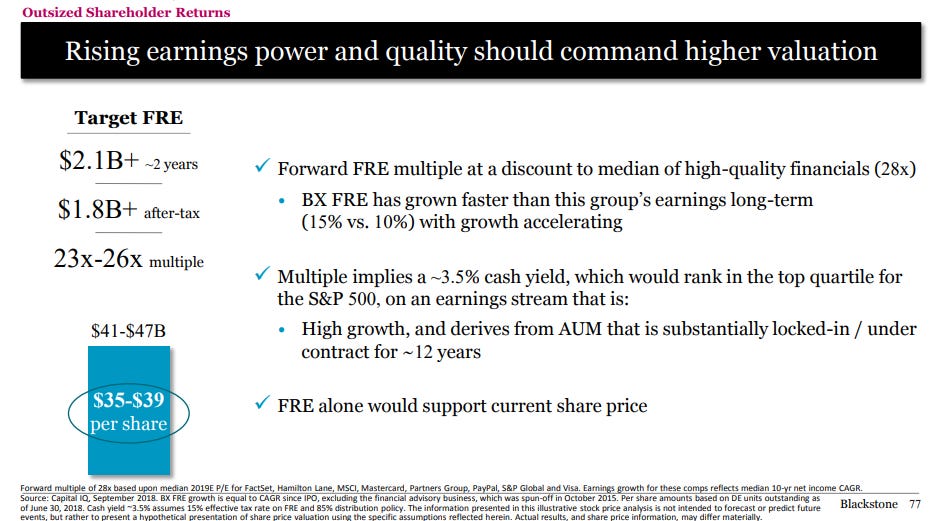
Blackstone (BX) has argued their FRE deserves to trade at 23-26x (below from p. 77 of their September 2018 investor day) (Note that BX's FRE definition is pre-tax)
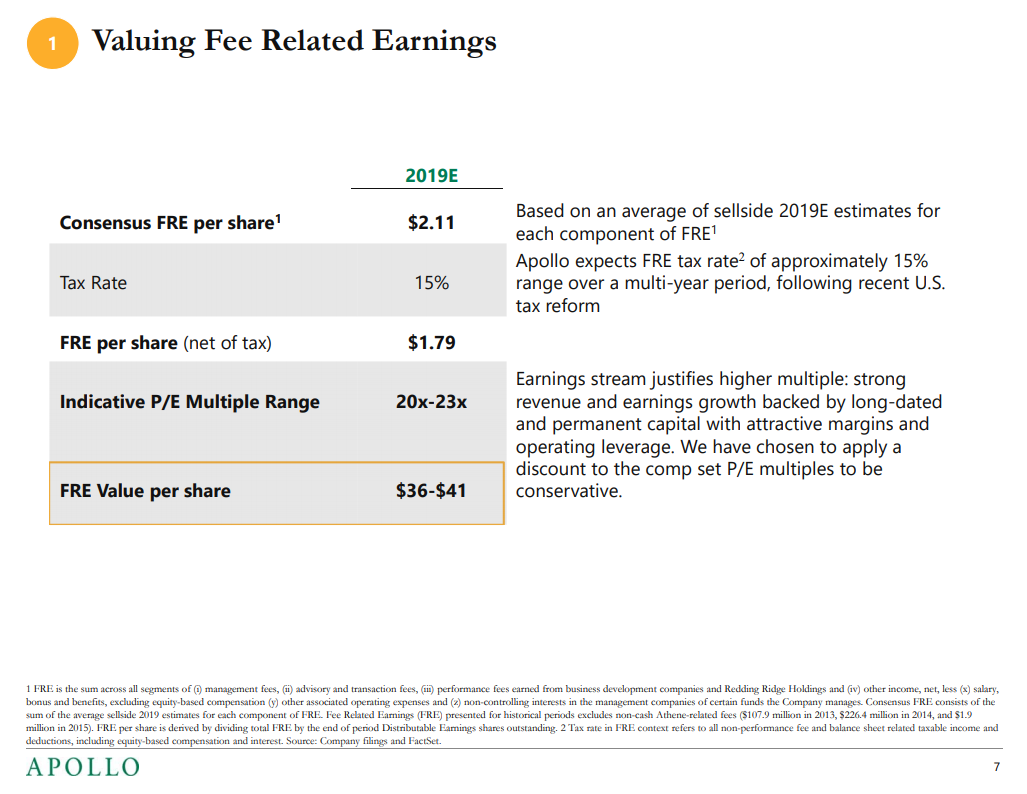
Apollo (APO) has argued their FRE deserves a 20-23x after tax P/E (below from their March 2019 "valuation framework" slides)
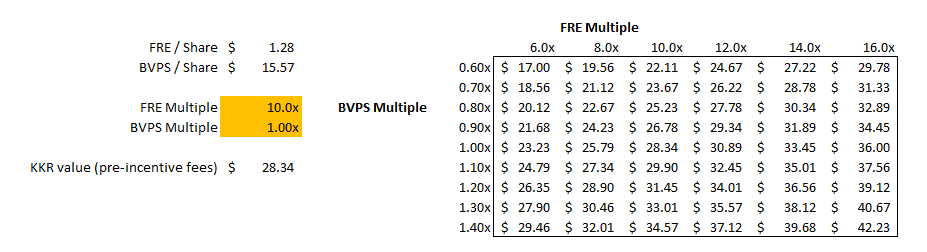
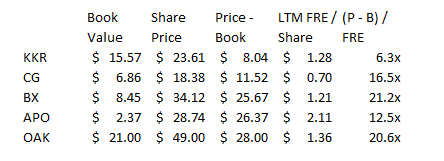
Obviously asking an asset manager how to value their asset management franchise runs the "asking a barber if you need a haircut" risk; of course they're going to think their businesses deserve high multiples! I understand that's a risk, but I think the underlying logic (that the management fees have fantastic visibility and are relatively locked in) does suggest that they should trade for a decent multiple. It also does appear like the companies use similar multiples to what they suggest they deserve publicly when performing internal valuation analysis. I'd also point out that M&A for major alternative asset managers is pretty rare, but in one of the few cases that we know of, it appears a similar multiple was used. Softbank bought Fortress in early 2016, and their SOTP analysis (see p. 58 and p. 67) valued their net management fees at ~13-15x trailing earnings and suggested precedent transactions happened at ~10x FRE (see p. 69). Those are healthy multiples but still a decent bit below the multiples we're talking about above; I think the gap can be bridged by considering that KKR / BAM / BX / APO's "franchises" are significantly better than Fortress or any of the M&A "peers" in the proxy (plus, multiples are up a decent bit since Fortress was bought!). KKR's LTM FRE/share comes out to ~$1.28/share (note this is pre-tax). Use the multiples BAM / BX / APO suggest and KKR's fee related earnings alone are worth $25/share, or more than today's share price. Even if KKR's FRE stream is worth 10x (in line with the far inferior peers from the Fortress proxy, and suggesting an after tax multiple of <13x), KKR's management fee stream would be worth $12.77/share. Combined with KKR's BVPS of $15.57, and KKR is worth $28.34/share, or significantly more than today's share price, before we even factor in KKR's incentive fees. I'm not a mammoth fan of data tables; they're a bit garbage in / garbage out. But I threw a lot of numbers and multiples out above, so I've included a data table below just so you can see the different sensitivities KKR has to book and FRE multiples. At today's prices, the market's implying that KKR is worth ~8x FRE/share and 0.8x book value (along with nothing for incentive fees, which we will address in a second).
My bottom line here is that KKR is cheap even before factoring in the incentive fee. A lot of investors struggle with the incentive fee. I'll admit I do too. The incentive fee is highly variable (i.e. in one quarter it could be zero or even negative if there are no realizations / an investment takes a write down that results in an incentive fee claw-back, while in another quarter there could be literally billions if KKR sells a company or two at big premiums), difficult to forecast, and very subject to market conditions. So the incentive fee certainly doesn't deserve the same multiple that the more annuity like FRE earnings deserve.... but it would certainly be a mistake to just ignore them! Here's what KKR's CFO said about their incentive fees at their 2018 investor day (see p. 65), "I do not know why, but what I have heard from our investors is that the carry that we have realized is episodic, meaning that it does not happen on a regular basis and so we are not getting the full credit that we should deserve. And Henry’s point to me was always, well go and tell them that the value proposition at KKR really is not about the management fee, it is about the carry." And that "carry" can certainly add up; in 2018, KKR earned $1.36B in "realized performance income" in 2018, or ~$1.63/share. That is a pre-tax, pre-expense number (~40% of realized performance income goes to a carry pool that is distributed to employees as incentive fees; see p. 97), but that is still a big number given we haven't given it any value so far! And the performance fee number has actually been relatively consistent over time; it's been >$1B every year since 2013, and KKR has argued they would hit $2B annually on their current AUM number.
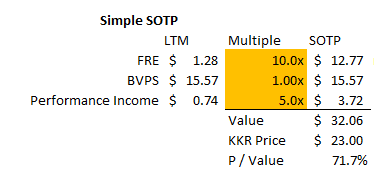
Over the past five years, KKR has averaged >$1.2B in Realized Performance income. I assume ~50% of that will get eaten up by taxes and the employee carry pool going forward, leaving a >$600m available for KKR shareholders in after tax earnings, or ~$0.75/share. I value that fee stream at 5x (the lower end of where Fortress valued their incentive fee stream if you look through their proxy), which adds another $3.75/share. Is that conservative? Almost certainly, but as I'll suggest in a second I think this whole exercise has been very conservative. Pausing here for a second, I've suggested that KKR's SOTP is ~$32/share. Below you can see the multiple I used to arrive at that value for each segment (Note that performance Income is average of last five years, not LTM, and note the numbers in the table might slightly defer from the numbers presented above because of rounding).
So, at today's share price of ~$23, KKR is trading for just a smidge over 70% of fair value despite using conservative assumptions for almost every metric (using an outdated book value, a super low FRE multiple, and a fully taxed performance income number well below where KKR thinks their current run rate is). ****UPDATE- Of course I spent all day yesterday writing this freaking thing (including the now laughable line "M&A for major alternative asset managers is pretty rare"), and as I went to publish Brookfield announced a deal to buy Oaktree for ~$49/share. Oaktree had a book value of $21/share and LTM FRE of $1.36; ignoring incentive fees (which shouldn't be ignored but bear with me!), you could say the deal argues Oaktree at 1.0x book value and 20x LTM FRE, very consistent with the valuation most of the asset managers have suggested their franchises deserve (and, given BAM has consistently suggested a 20x FRE valuation framework, certainly suggesting that BAM believes what they tell shareholders!). We'll get more info on Oaktree and how the various pieces of the company were valued when the proxy comes out, but given the size of the deal and the validation of the valuation framework I thought it would be silly not to mention it. I also think it suggests interesting M&A possibilities going forward; Marks / Oaktree clearly took the Brookfield deal as much for cultural reasons as for anything else (Marks will retain control of Oaktree for several years and join BAM's board), and I would not be surprised to see several other M&A deals going forward as the original generation of alternative managers look to retire / cash out. Those type of culture / retire deals can have very interesting economics, and I wouldn't be surprised to see KKR and other alternative players see some opportunities to pursue M&A at interesting prices going forward. Given KKR's size, M&A probably doesn't move the needle too much, but it should add to incremental intrinsic value.****** Ok, there was a lot above. Honestly, I felt silly typing it all knowing that it was going to come to the same conclusion the tl;dr laid out (that KKR is undervalued and their valuation framework was probably reasonable), but I thought it was important to establish a solid valuation framework for discussing some of the more qualitative factors when evaluating KKR.
Let me start with the most important piece: I believe both the FRE and Performance Income numbers we used above were way too conservative. I've already suggested that the multiples I used were too conservative, but here I'm talking about the actual earnings numbers used for KKR. While we've been valuing KKR on an overall basis, the economics of each individual fund is wildly different, and KKR has been seeding a bunch of new funds that have had a negligible impact on the income statement over the past few years but should generate substantial profits in the near future. An example might show this best: let's say you run an asset manager that runs a U.S. only private equity fund. The fund has great success, and you decide to launch a European fund. You'll need to go rent office space and hire a European team before the new fund has ever earned a dime, and that expense hit will be a bit of a drag on the income statement in the near term. Eventually, you'll launch the first fund, but it will probably be small and even if it's a success it won't really move the needle. However, if it's a success, you can probably raise a much bigger second fund, and with the infrastructure / team now in place every incremental AUM should have huge operating leverage as its fees flow almost directly through to the bottom line. Over the past few years, KKR has been focused on investing and scaling a bunch of different business lines, and as those funds mature it should have a dramatic impact on KKR's income statement. At a recent conference KKR said 25% of their AUM generated >90% of their realized carry over the LTM, and that the rest of the funds should begin generating performance fees in the near future. As these funds scale, I expect the income numbers I used in my SOTP valuation to prove wildly conservative.

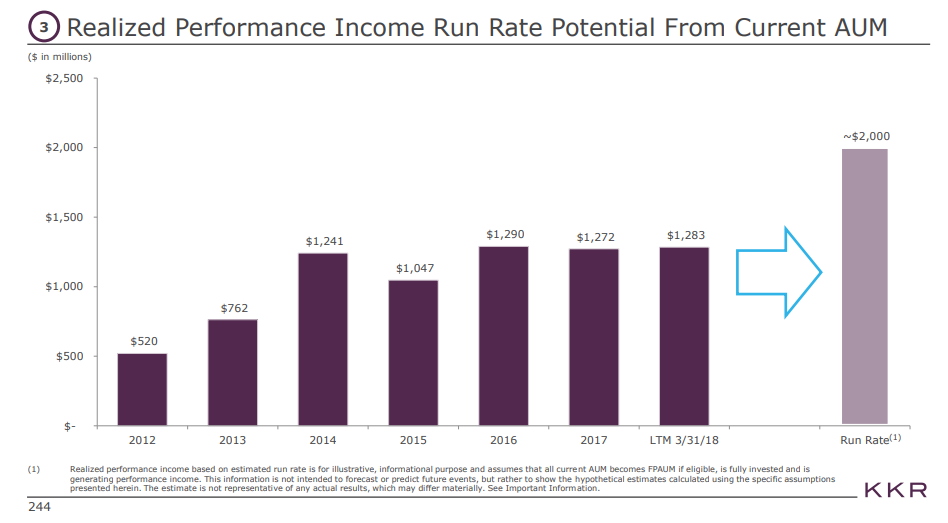
Here's a quote from their investor day that helps break down that chart a bit further (see p. 16)
So this is a chart Scott put up earlier. This is a historical snapshot of our carry and incentive fee payments at the firm. Relatively stable and growing over time. When you factor in what I just mentioned about the latent potential of our carry-generating AUM that is already in the ground, we believe it is easily $2 billion or more on a run rate basis. So we expect a meaningful step up in that line item on our P&L.
So again, I am going to walk you through some examples of how the scaling, this inflection point, really work in our business as we think about scaling and diversifying our business model. We have seen it in credit, where we have gone from 0 to roughly $60 billion over 14 years; we have seen it in capital markets, which has been around for around 10 years now from a standing start to over a $400 million contributor to the fee line at the firm. We have seen it in Asia where we have gone from $4 billion of AUM back in 2007 to now $18 billion in private equity AUM in the region and we are seeing it again for the first time in real assets where our infrastructure business is finally starting to sale and get to that sweet spot at this inflection point where we have gone from 0 to $13 billion of AUM in the last decade. These are the four businesses near that inflection point. As you saw on the prior slide, we probably have a dozen other strategies and businesses that are between one to five years old that have not even reached this level of scaling.
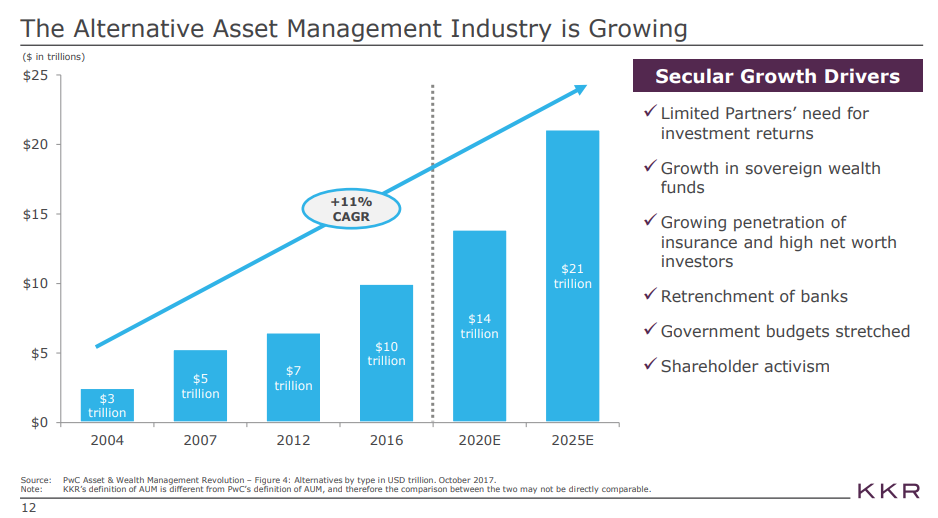
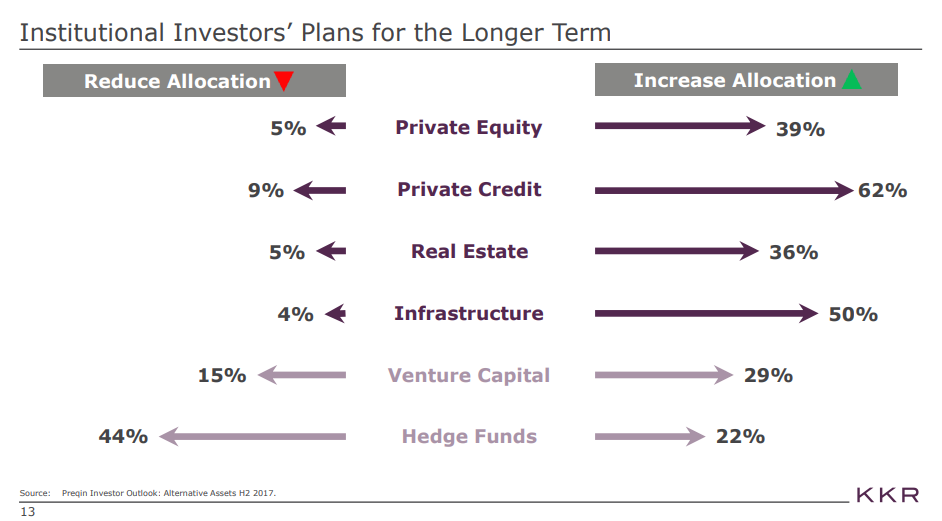
So one tailwind that I expect to kick in is simply all of the funds KKR has raised over the past decade fully "kicking in". Another important tailwind is my expectation that the alternative asset management industry will continue to grow over time and that the major alternative asset managers (KKR included) will grow faster than the industry over time. Let me start with the first point: the alternative asset industry will grow over time. This is not a bold or contrarian call; in many ways, it's just math. Assets tend to grow over time as they realize a return; given the alternative asset managers are in the business of generating returns, over time their overall asset level should grow simply from those returns. In addition, traditional investors in alternative assets (like sovereign wealth funds or college endowments) will continue to grow, and as they do so they will increase their investment in alternatives (assuming constant asset allocation).
In addition to just growing assets, I expect the alternative asset business to take market share (generally from more traditional investments like passive equities or bonds) over time. This call is slightly more contrarian, but I think it makes sense. You and I can argue all day about if private equity and other alternative assets actually add value or if they're just a secret way to get levered beta; however, if you're an advisor to institutional investors, in large part your job depends on your ability to differentiate between different assets. If you ever came in and said, "Hey, all of this asset management stuff is bullshit; why don't we just go 60/40 stocks/bonds in an index fund?" you would be out of a job one way or the other (either immediately because your fund fired you, or over the medium to long term because you just allocated yourself out of a job). In addition, alternative assets comes with a "sexy" factor that investing in an index simply doesn't; if you're the head of a sovereign wealth fund and you invest all your money in index funds, that might save your fund a few basis points but you just cost yourself an invite to all the fun alternative conferences. The money isn't yours, and the industry practice is to invest a huge chunk into alternatives, so why not go with the herd and keep getting invited to the fun parties? (Note: I only go down this line of thinking to show that alternative assets are likely to grow significantly even if they don't add any alpha versus index funds, as many people claim. I actually do think the good managers add some alpha, and if you believe that alternatives will continue to grow because they're adding value in addition to all of the factors above. Also, it's worth noting the "why not invest in index funds" works well when comparing to private equity or hedge funds, but it really doesn't work for the other fund lineslike real estate or credit investing).
In addition to the industry growing over time (from both wallet share growth and from general asset growth), I expect the major asset managers to gain wallet share over time. I've previously described this effect as similar to the old "nobody gets fired for buying IBM" anecdote.
If you’re a pension fund employee in charge of private equity allocation, you have two choices: you can give the allocation to an unknown startup, in which case you’ll get fired if it does poorly and a pat on the back if it does well. Or you can give the allocation to one of the ~seven major private equity players, in which case you’ll get a pat on the back if it does well and a nod of understanding if it does poorly because every other pension fund in the world will have invested in the same fund and your results will look like everyone else’s. As we prepared to publish this letter, the Wall Street Journal published an article on Blackstone’s record $20B real estate fund that captured this line of thinking perfectly, “Investment officers working for pension funds, endowments and other institutional investors prefer firms with marquee names and long track records because they have less explaining to do if things go wrong.”
And we can see the beginnings of that effect in KKR's AUM over the past ~15 years: KKR grew AUM 20%/year versus the overall industry growing ~12%. Over time, I expect KKR (and its major peers) will continue to take share, and that will drive even faster asset growth.

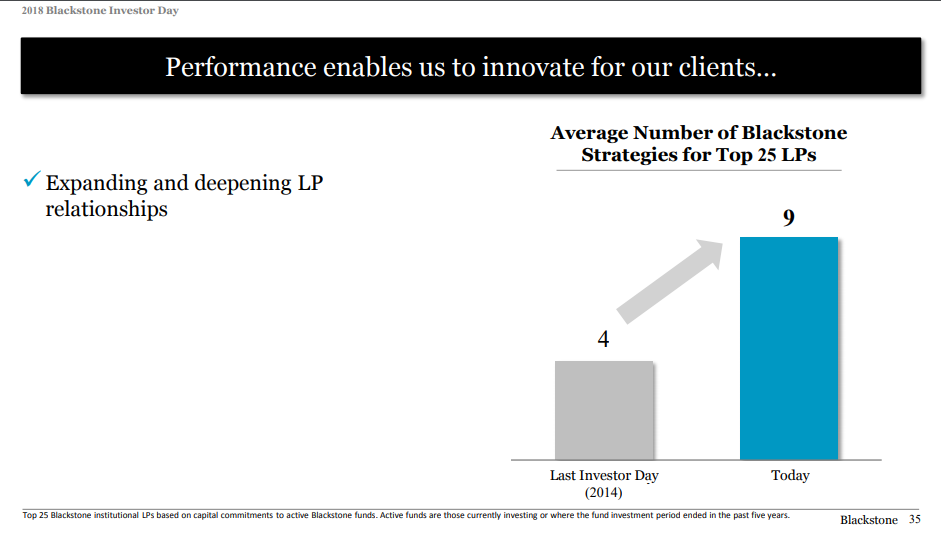
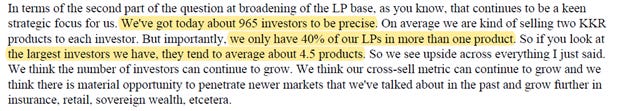
Note that this growth does not need to come from raising progressively larger funds in the same strategy (though Blackstone's latest $20B fund is testing the thesis that there's a cap on these funds); the growth will likely be driven by launching new asset strategies and geographies (i.e. Asia Direct Lending, Africa Infrastructure, etc.). So, in general, you'll see some of this increase in wallet share from LPs writing larger checks to individual funds, but the big gains will actually be from LPs subscribing to more products with the same managers over time. And indeed we're seeing both things happening; for example, Blackstone noted that the average number of products their top 25 LPs subscribe to went from 4 in 2014 to 9 in 2018 (see slide below), and KKR continues to see gains in both products / LP and check size / LP (see quotes below, both from KKR's Q4'18 earnings call).
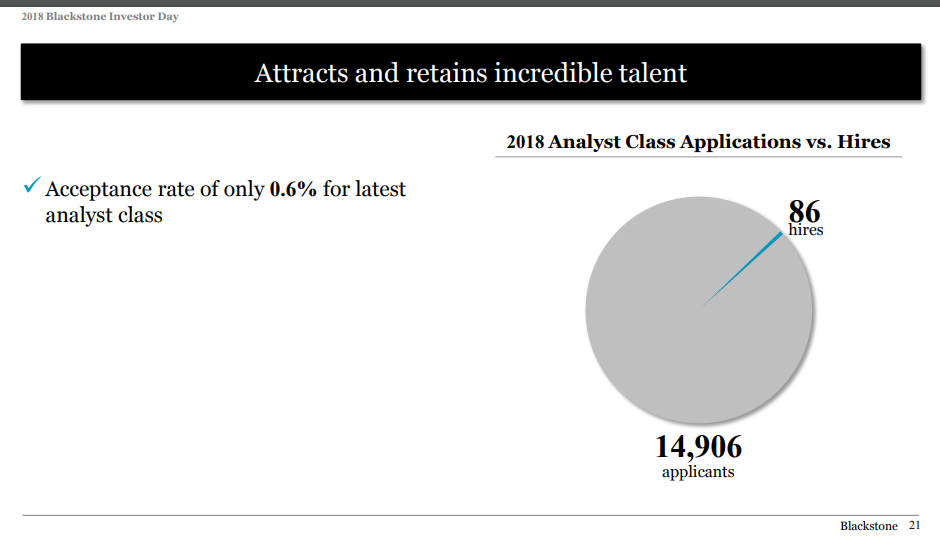
Very related to "IBM" tailwind above, I think the alternative asset managers have a massive hiring tailwind (value act called them a "competitively advantaged human capital franchise" to refer to this advantage). Think about a super talented software designer today. In general, if they get an offer to go work at Google and random software company X, they're probably going to choose Google for the name / resume power. I suspect the alternative asset managers have a similar advantage in finance today; if you're a talented young finance person, the best route to show that is to go work for two years at one of the major alternative managers. That's a mammoth advantage for the large alternative asset managers. It's not just that talented analysts are more likely to do better work (that helps, but analyst work is generally a bit more on the grunt slide), but having talented analysts gives firms first shot at promoting them (so that they one day become a talented partner) or maintain a good relationship with them (so that if they become a talented CEO later in life, they're more likely to call KKR when thinking about a take private or selling off an unloved division). Maybe this seems like a small moat, but if you think investing is a game of skill (whether that skill is actual analytical investing skill or networking skill to be someone's first call when they're looking to unload a business), then having the best talent pipeline matters. (slide below is from BX's 2018 investor day; acceptance rate isn't a perfect proxy for a hiring moat but I think it helps illustrate what we're talking about).
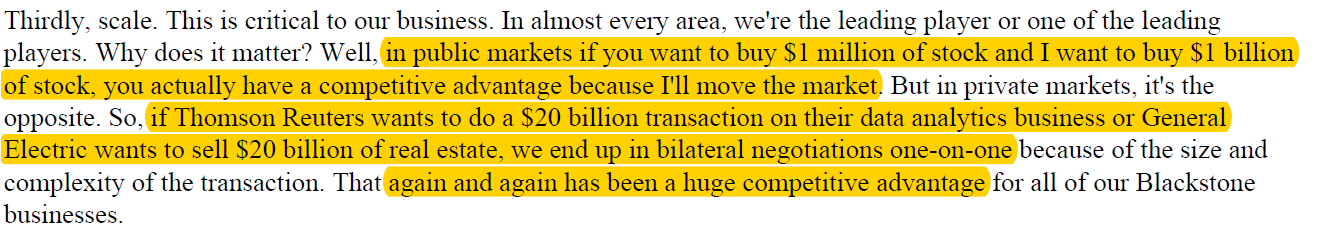
In addition to the hiring and "don't get fired" asset raising moats above, I think the large alternative managers have a scale advantage when it comes to buying companies. This comes in two forms: data and lack of competitive buyers. Let me start with the later point (lack of competitive buyers), as I think that's more proven. If you're a company running a sales process in ~$500m EV range, there are a near infinite amount of buyers who can compete in an auction: dozens of smaller private equity players, large family offices, etc. However, if you're a company running a sales process in the >$10B EV range, the pool of potential buyers is much smaller. There are only a handful of private equity firms even capable of writing an equity check of that size, and that lack of competition should provide for better prices for the buyer (less competition = lower multiple). That advantage gets even better for more complicated processes. Consider, for example, a carve out of a large division (something like Johnson Controls recent deal with Brookfield). A carve out is a complicated process that involves a lot of partnership between the buyer and the seller; if you're talking about carving out a division worth >$5B, there are ~5 firms in the world that have the skills to do that and can write a check of the size needed to somewhat properly value that business. I'm not suggesting that the lack of competitors is going to allow large firms to "steal" multi-billion dollar buyouts / carve outs; however, I am suggesting that the rather limited competitive landscape allows the private equity firms to get somewhat advantaged pricing when buying these firms, which should drive sustainable alpha over the long term. I also think it's likely that the large alternative asset managers will increasingly have a data advantage over time. In addition to owning a variety of portfolio companies and having access to their internal data, the alternative managers get access to hundreds of deal data rooms every year. Over time, that combination should give the large players a tremendous amount of proprietary data that will create interesting opportunities when it comes to things like machine learning (either to improve deal making decisions or for improving their companies) and buying / valuing new businesses. Blackstone's CEO has recently suggested that their size is an advantage, and they are starting to use the data their firm generates for just this type of alpha opportunity. I understand that both of these size / data "alpha" advantages are a bit more controversial and most investors are likely to discount them; the beauty of KKR is that at today's prices you aren't paying anything for those advantages. I do think they're real and will help KKR (and its peers) continue to deliver solid returns over time (below is a quote from Blackstone that discusses the "size" advantage).
Before I wrap up, one other thing I like about KKR specifically versus peers: its balance sheet. In Q3'2015, KKR switched from a variable distribution policy (which most of their peers pursue) to a fixed distribution policy. The new policy let KKR retain more of their earnings, which they could invest in their funds or use to buyback shares. As mentioned earlier, I'm a fan of KKR's balance sheet investments, which give investors advantaged access to KKR's alternative investments that they couldn't otherwise get. KKR's always had a larger (relative) balance sheet than peers, but this policy has helped them accelerate that gap. Below I've shown KKR's book value and share price versus three of their peers (update: make it four peers; OAK got acquired this morning so I threw them in as well). This is far from a perfect analysis, but I think it does a reasonable job of getting across that KKR keeps a bigger balance sheet / investment in their funds than peers. While the market might discount that exposure, I think it provides significant upside.
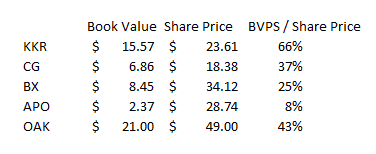
Another way to look at it: if you assume the balance sheets are worth book value (and again, I think they are), what is the implied FRE multiple across the companies? This isn't a perfect line of thinking, but I think the results show just how undervalued KKR is versus its peers (and I generally think all of the peers are undervalued as well! obviously this analysis ignores incentive fees, but I think it gets the point across).
Odds and ends
The thing that first got me interested in the alternative asset managers was the line below from BAM's 2017 annual letter. Again, take it FWIW given it's coming from an asset manager "pitching" their own stock, but I think the quote below applies very squarely to KKR (and very much relates to the "multiple young strategies ready to scale" slide / discussion from earlier)
"This business is currently generating $2.5 billion of annualized fees and target carry, and we expect this to increase substantially in the coming years as we complete fundraising for our next series of flagship private funds, in addition to a number of newer investment strategies. We believe that even by applying relatively conservative multiples to these earnings streams the resultant franchise value is substantially higher than $16 billion, and should continue to expand rapidly. It is also worth noting that we believe most of the other large alternative investment managers are similarly undervalued, but we have one additional factor to note: our franchise, while large today, is not as mature as others. In particular, we do not have many large funds nearing their end-of-life phase over the next five years, and our successor funds are still growing at a substantial rate. This means that we are stacking ever larger new funds on top of existing funds, without the corresponding return of capital to investors. In seven to 10 years, we will be in the same place as the others and distributing greater amounts of capital – but in the interim, our growth rate is much faster."
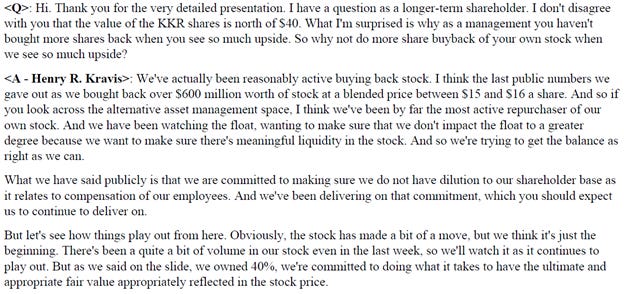
The most constant push back I hear for KKR and other alternative asset managers is "these are supposed to be super sophisticated financial investors; if their stock is so undervalued, why aren't they buying the heck out of it?" I get it, and I wish all of the asset managers would be more aggressive repurchasing shares. Several shareholders have actually pressed alternative asset manager teams on this point; the response from the managers has varied from relatively thoughtful (see KKR's quote below from their 2018 investor day) to angry (Blackstone calling analysts idiots for asking the question). Most of the alternative managers have committed to "flat" share counts (buying back enough shares to offset employee stock issuance), which I think is a step in the right direction given the degree of undervaluation here. Over time, I'd expect share repurchases and capital returns to get more aggressive, mainly driven by the fact the companies will be drowning in cash flow as all of their funds ramp up and there are only so many new funds they can invest in / seed.
A very related risk: when will the markets give the alternative asset managers credit for their value? After all, the alt managers have been making the argument their shares are undervalued for literally years, and their shares have continued to underperform. I don't have a great answer, but I would note that the math starts to get really crazy if the shares remain undervalued. KKR has publicly said they think they can get book value >$60/share in 10 years; if they can do that and maintain a 10% ROE, they'd be doing $6/share in earnings from their balance sheet alone (i.e. before the FRE, which will be mammoth). The stock market is going to have to respond to that at some point, because if it doesn't KKR is going to be able to buyback all of their free float with one or two years worth of investment profits (I would guess KKR also raises their dividend in the meantime, so the dividend yield would likely get nutty as well).
One thing that's unique about KKR versus their peers (in addition to KKR's larger balance sheet) is their capital markets division (KKR gave a very good presentation with a ton of detail on the segment in November 2018). I believe most other alternative asset managers have one, but KKR's is much larger and does much more third party work (still limited, but I don't think any of the other players do any third party capital markets work at this point). KKR pitches this as a unique way for them to capture more value: by syndicating debt or equity themselves, they can capture the syndication fees and keep more of the economics of a transaction. I think the strategy makes tons of sense and will probably allow KKR to capture a lot of value that would have been lost to banks over the long term. Still, capital markets is probably a much lower quality business than the management fee stream, and capital markets revenue is included in KKR's definition of FRE. KKR gives enough detail on capital markets that you can adjust the capital markets portion of the business to a lower multiple if you want to. I don't think it moves the needle enough to worry too much about it; for example, if I thought capital markets was worth 6x FRE while the rest of the FRE stream was still worth 10x, it would knock <$2/share off of my KKR fair value. Given how undervalued I think KKR is and the huge growth opportunities I think KKR has, it's not worth splitting hairs over.
I know lots of people who are worried about investing in alternative asset managers over economic cycle fears ("what happens if we have a recession?"). I hear that risk, and I'm sure there will be some mark to market noise, but I think a recession would probably ultimately be really good for the alternative asset managers. First, at the holding company level (i.e. the level we invest at), the asset managers generally have very good balances sheets. Combined with their strong cash flows from management fees, the alternative managers could look to deploy their cash to buyback their own shares or to increase their investments in their portfolio companies at attractive prices. At the fund level, most alternative asset managers have huge amounts of "dry powder" (uncalled commitments) that they could put to work at much lower multiples in a recession / down market. KKR, for example, had $58B of dry powder at YE2018; if we saw some real blood in the streets, I would guess all of the asset managers would have a field day putting that dry powder to work and would eventually realize mammoth incentive fees from doing so.
I know a lot of people are worried about what happens to the LBO model if interest rates rise. KKR did a whole discussion on this at their analyst day (see p. 75); I generally agree with them and don't spend a lot of time worrying about it.
A better question that what happens in a recession might be what happens if there isn't a recession and markets continue to race? Private equity firms have mammoth amounts of dry powder and are desperately searching for places to put capital to work. If they can't find reasonable deal targets that hit their 20%+ IRR threasholds, are they willing to lower their standards and risk some poor performing funds in order to deploy that dry powder? Or would they return that capital to their LPs, forgoing the fees and possibly disappointing LPs (who had budgeted to have that money invested)? There's no easy answer here.
Risks
Reputation: By far the biggest worry is reputational. An alternative asset manager can survive bad performance in a fund or three; they might have to take a "down" fund round (raising a successor fund that is smaller than their predecessor), but given their track records and brand names they would likely get several shots to turn around subpar performance. However, if an alternative manager was implicated in some type of scandal (bribing allocators to steer money their way, dealing with shady governments to win below market deals, etc.), allocators are going to pull their money first and ask questions later. This is probably the risk that keeps me up most at night: private equity players are extremely competitive and driven, and when you give really driven people the opportunity to earn life altering sums of money and power, they'll often push the "line" as hard as they can to "win". My big worry is that someone jumps through that line and the firm finds themselves in some type of scandal. I'm not sure there's a way to get fully comfortable with the risk aside from the fact KKR has survived >40 years and hasn't had a firm ending scandal yet!
Regulation: There are probably two differing forms of regulatory worry here: taxes and "post crisis bank treatment".
Tax Changes: Most of the alternative asset managers went public as publicly traded partnerships. In 2017, KKR became one of the first alts to convert from a partnership to a normal C-Corp. The conversion results in KKR paying higher taxes over time, but the hope was that converting would open KKR up to a new class of shareholders and reward them with a better stock price. One of the reasons KKR felt comfortable converting is the new, lower corporate tax rate meant that tax difference between being a partnership and a C-Corp was much lower. However, a conversion is a one-way ticket: once converted, there's no going back to a partnership. If the corporate tax rate were to rise in the future, KKR would be stuck in C-Corp, and they'd have a higher all in tax rate than their peers who had remained partnerships. (The tax treatment of incentive fees could change as well, but given I don't think investors are paying anything for incentive fees at current prices I think this would qualify as a small negative, not a massive game changer).
2008 post crisis bank treatment: I don't want to dive too deep into political waters here, but I don't think it's a stretch to say that rich private equity managers would make an easy target for Democrats trying to prove their "champion of the people" mettle. What happens if they start hauling in private equity managers twice a year to explain to Congress why they are firing hardworking people at all of their portfolio companies while raking in billions of profits each year? I'm not saying anything would come from those hearings alone, but that type of noise can cause companies to get less aggressive, cause allocators to grow more wary giving them money, and cause potential employees to think about heading to other fields. You could also imagine some type of extreme legislation getting proposed to clawback private equity profits to compensate fired workers. I'm not sure; we live in crazy times and rich private equity managers who fire people are an easy target. Probably nothing comes from this but it's a risk to consider.
Incentives (do insiders want to grow share price or grow assets?): Insider ownership of KKR (and all alternative managers) is extremely high; the principals own literally billions of dollars worth of stock and have huge investment in the funds, and that insider ownership generally applies up and down the executive team. However, it's an unavoidable reality of the asset management business that managers are almost always incentivized to grow AUM, even if it means slightly diluting their overall investment returns. There's some worry that could happen here, and it would result in middling balance sheet performance over the long run and possibly dilute the KKR "brand". Still, as buying KKR gives us access to the GP economics, outside shareholders would probably do alright even if KKR grew themselves into middling returns.
Insiders also have near absolute control of KKR through super voting stock, so there are risks that they try to screw shareholders over. Certainly a risk, but I'd note that insiders are generally paid extremely well and own tons of stock. If they tried to screw minority shareholders, it may be shooting themselves in the foot as having a public equity is really useful in structuring succession, so hitting minority shareholders could damage their ability to maintain an enduring franchise that survives its founders.
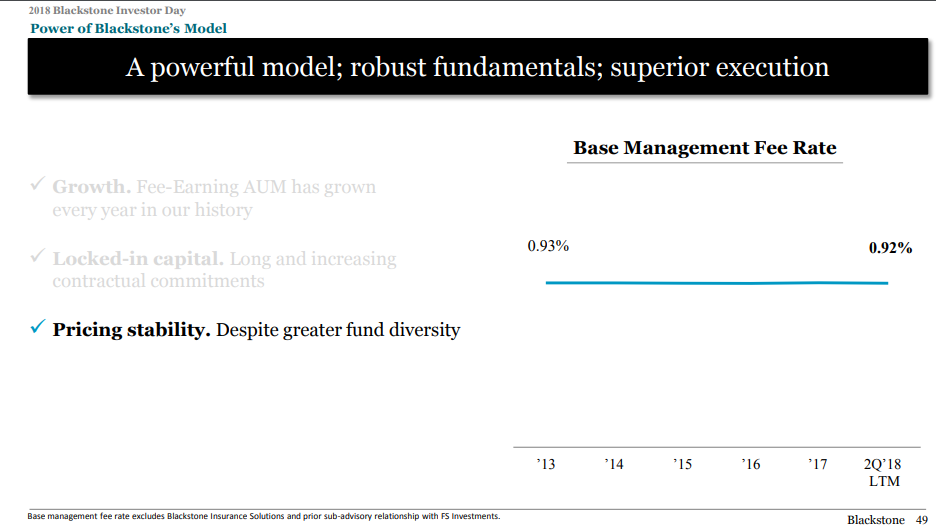
Fees come down over time: We've already seen the trend to indexing and lower fees on the active management equity side; what if that happens on the private equity / alternative side? Blackrock has already tried to enter the space with a lower fee product. Fees coming down is certainly a worry, but as long as private equity continues to deliver good performance (and retains all of the softer advantages I discussed above), I think they'll be able to "hold the line" on fees. In addition, more and more of private equity's capital comes from longer duration products (like managing BDCs), which should be less susceptible to fee pressure. Note that we haven't seen much fee pressure at the alt. managers to date (slide below from Blackstone's 2018 investor day).
Fund performance: Historical returns have been really good, but what if KKR (or another manager) puts up a bad fund or three? Obviously that's not ideal, but I think given their reputations and track record, they would probably be able to raise several new funds to get a chance to redeem themselves. At some point, the funds need to deliver at least passing performance to justify existing, but given the scale advantages mentioned above, the odds of delivering funds with performance at least acceptable enough to continue existing / raising funds are probably in KKR's favor.