A weird and quick one this weekend.
Over the past few years, I feel like I’ve some traditional correlations get broken.
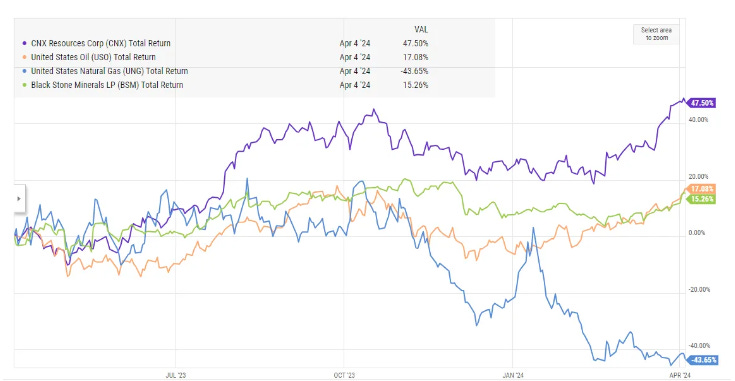
I think I can show this best with an example. Consider two companies that I’ve looked at in the past: CNX and BSM. These are energy companies, so it makes sense that they’d trade in line with moves in commodities. Here’s a chart of them over the past year versus oil and natural gas.
If you looked at that chart, you’d likely come to the conclusion that these are largely oil exposed companies. BSM’s stock price moves almost one for one with oil, and CNX seems much more correlated to oil than natural gas.
That would be an easy assumption…. But it’d also be wrong. These are largely natural gas companies. For example, ~90% of CNX’s revenues and reserves come from nat gas:
And ~66% of BSM’s reserves are nat gas:
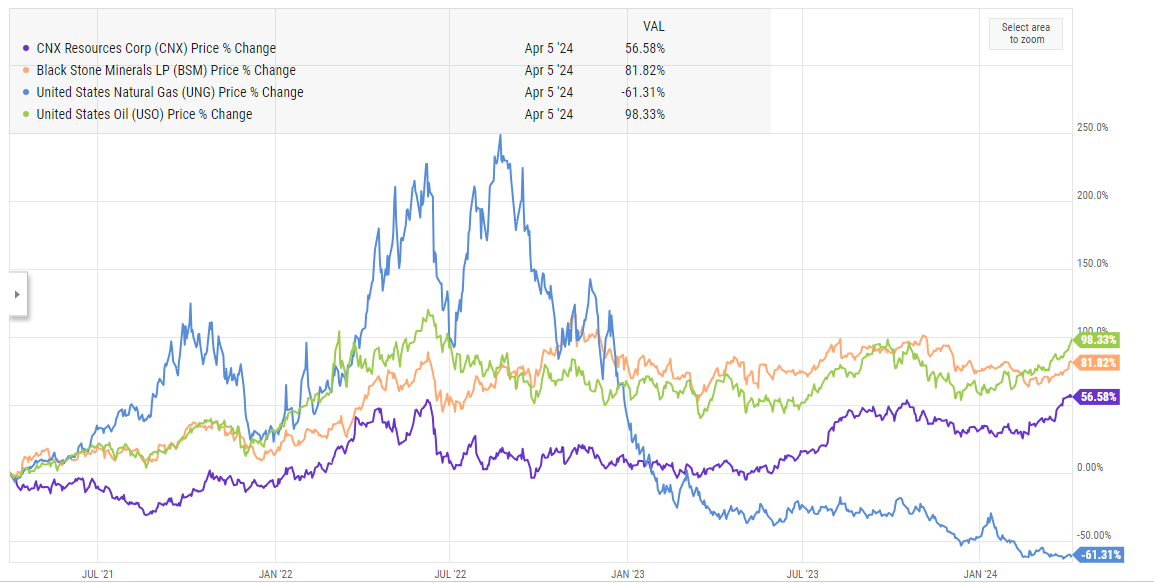
And the past years move just continues a trend that’s played out over the past several years. When natural gas was really spiking back in 2022, these companies didn’t really move up that much. Now, both companies hedge a lot of their near term exposure, so they weren’t fully exposed to that massive price rip in the short term…. but you can run the same numbers on out year natural gas and you’ll get the same (surprising) lack of correlation.
I’m not saying this is a perfect correlation or chart. The spot price for natural gas is famously volatile; what matter more for these names is the long term average price for natural gas, which is much less volatile (though it has come down quite a bit too!). And obviously there are tons of other things that can impact stock prices (capital allocation, interest rates, cost to get the gas out of the ground and to market, etc.)
But, still….. it seems pretty clear to me that these stocks are trading more in line with the day to day moves in oil prices (which matter much less to their business) than with the outlook for natural gas, despite natural gas being by far a bigger driver of for those companies.
There are other examples of stocks seeming to move out of line with their biggest drivers. For example, banks broadly seem to be trading in line with moves in interest rates (i.e. if rates go down, all banks go up), even though there are a lot of banks that make more money when interest rates go up, so at minimum you’d think banks that do better when rates move up would drop less than more rate sensitive peers…. but they all seem to have similar correlations regardless of their underlying exposure.
Or, here’s a fun one. As Kerrisdale pointed out, MSTR is basically levered BRC at a premium. I get it’s effectively a meme stock (or at least meme adjacent), so reading anything into its stock price (particularly its day to day / minute to minute price) is dangerous / nonsensical, but there’ve been multiple days recently where bitcoin would be up / down and MSTR would be the reverse. Again, I know, I know; you sohuldn’t try to read anything into short term trading dynamics in a highly shorted stock….. but it’s still interesting!
I can find other examples of this correlation breakdown, but none are super easy to throw on a graph so I’ll stop there.
Anyway, I guess I have three thoughts that flirt around my head when I see correlation breakdowns
Am I just imagining it? Maybe I’m just looking at one or two strange examples, or maybe I’m missing something else happening.
I don’t think so; the MSTR example is a little silly but it does appear to me that nat gas focused names really are trading way more in line with oil than nat gas, and I don’t think it’s my imagination that I’m seeing something similar happen in other places.
Assuming I’m not imaging it, what’s causing that divergence? Is it just passive flows / ETFs? Or is there something else?
Is there a way to take advantage of that divergence?
My loosely held theories / answers to those questions are
No, I’m not completely imagining this. Something weird is happening here, though maybe not quite as extreme as I’m painting it
Yes, it’s probably caused by passive flows
In the short term, there’s no way to take advantage of it…. but in the medium to long term, it absolutely presents opportunity. If you were buying the nat gas names when they hadn’t moved on the spike back in 2022, you did really well holding them through today despite the collapse in nat gas prices. You could probably sell them today and wait for a better entry point a year or two down the line when the fundamentals catch up to the current nat gas outlook….
One great way to take advantage of this: It really helps if you have a company that’s buying back stock / returning capital. If the stock isn’t moving while cash flow is starting to roll in, that capital return can get very accretive….
So that’s what’s been flitting around my mind this weekend. Have any favorite stocks where the market is ignoring some type of underlying inflection? Feel free to throw them into the comments!


Here's some of the reasons why I think BSM should correlate more to oil prices than natural gas prices:
BSM (Black Stone Minerals) is an oil and gas LP which owns royalty interests on approximately 7MM net acres in the US. BSM received about 60% of its revenue from oil production in 2023 and 44% in 2022. So while natural gas is a very large part of production it's less relevant for actual revenues.
BSM also runs with swaps on about 60% of their natural gas production 1 year in advance. (they also have swaps on about 55% of their 1 year advance oil production as well) So there is a natural damping of volatility as compared to both oil and natural gas prices. However, since natural gas is naturally more volatile you should generally see a higher correlation to oil prices.
Royalty companies can sometimes act as a sort of annuity where if you get more of your payout (read drilling) earlier then you get a higher IRR because the earlier payments are less discounted (like a PE fund with a great IRR, but maybe low MOIC due to paying out earlier). So, because BSM has a royalty interest I would expect it to trade more in line with drilling activity (which I believe is more correlated to oil prices than natural gas prices [natural gas can sometimes be just a byproduct of oil drilling]). BSM (and royalty companies in general) also tend to receive minimum payments as part of their leases so even if natural gas prices fall below "profitability" on a single well basis, BSM will still receive profitable payments. These should all make it trade more in line with oil prices than natural gas prices.
BSM is also a limited partnership (on top of being a royalty company) so I don't think it is eligible for many indices. I'm fairly confident that it isn't included in any passive index. You also get the additional "benefit" of a K-1, which is particularly fun this time of the year.
I doubt that this is a perfect answer to the question, and I'm probably missing something, but maybe it will help. For anyone who is curious about BSM in general, Andrew had an excellent podcast with Andrew Carreon on it in 2022.
I can't comment on BSM and CNX; however, for some of the Canadian natural gas companies, I have noted that a relatively large percentage of their profit (but not revenue) was related to the price of the natural gas liquids components they obtained from their natural gas. These natural gas components were highly correlated to the price of oil. So, even when the price for the dry natural gas component was very low, the companies seemed to be happy to pump all they could (especially from wetter gas reservoirs) in order to make a profit from the liquids components. Might that contribute to the better correlation to oil than gas that you observing?