
A few weeks back, I posted “Weekend thoughts: the less efficient market, part 1” in response to a bunch of thoughts I had after reading Cliff Asness’s the less effecient market. Today’s post is, of course, the part 2 to that piece.
Part 1 discussed the paper overall and how I thought active alpha could be a “shipping” market now (I know that analogy sounds weird; go read part 1, I promise it makes sense1).
There were two thoughts from that post that I saved for part 2 that I’ll be discussing today. Those thoughts are:
The semi-liquidity discount and the liquidity smile curve
Capex in the ground: where I think there’s a lot of market inefficiency currently.
Let’s start with the first: the semi-liquidity discount and the liquidity smile curve. The paper bashes private equity and alternatives for “volatility laundering.” To simplify, private equity shares a lot of characteristics with public equities, but a lot of allocators seem to private equity because private equity does not need to mark to market. Something like BREIT serves as a perfect example: in 2022, Blackstone marked BREIT up 9.3% when a basket of REITs fell 22%, raising plenty of questions about how accurate the marks were.
I generally agree with the paper on bashing volatility laundering; however, I do think that argument misses the other side of the coin. In public markets, stocks with more liquidity get huge premiums to stocks with less liquidity. These are rough numbers from my gut (I’m an investor, not an academic), but I base them on recent experience:
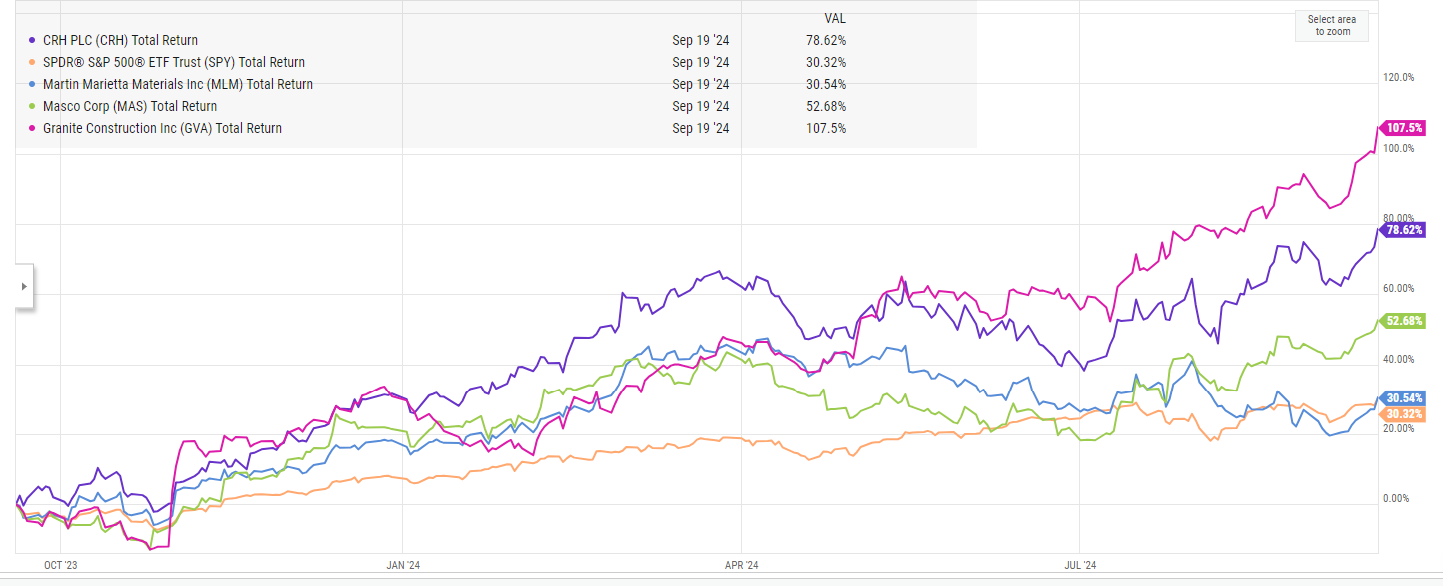
Domestic versus international: a stock that trades domestically will trade for a ~20% premium to a stock that trades internationally, even if the two have a similar risk profile. And I do mean similar; consider CRH, which Voss Capital made a compelling case was undervalued in large part due to its listing. Sure enough, CRH switch their listing roughly a year ago, and the stock has screamed higher since relisting to the U.S. Same company, different listing, much better multiple.2
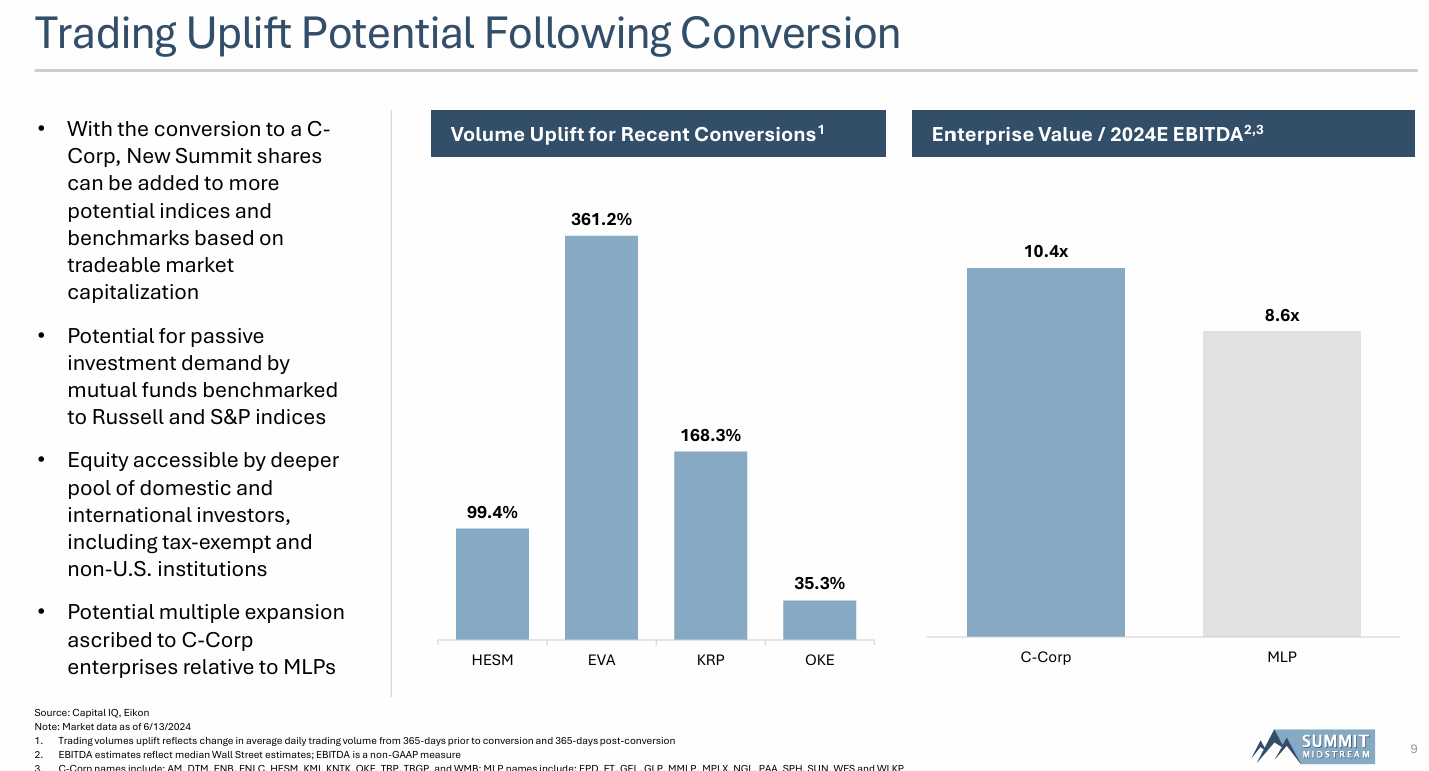
Stocks that go from mlp to c-corp: Stocks that trade in MLP form have a limited buyer pool for a variety of reasons (I believe the reasons are largely tax related, but I am not a tax advisor and this isn’t tax advice!). Because of that limited buyer pool, a variety of MLPs have been pursuing C-Corp conversions, and the result has been a much more liquid stock that tends to trade for a better multiple… what’s particularly interesting about that is, all else equal, a company in an MLP wrapper should trade for a higher multiple than a C-Corp. Why? Again, not tax advice, but MLPs don’t need to pay taxes at the corporate level (they pass taxes on to their shareholders) while C-Corps do need to pay taxes at the corporate level. Thus, the C-Corp has the dreaded “double taxation” where they pay taxes on their profits and shareholders will need to pay taxes on dividend / capital gains they receive while the MLP avoids that double taxation. All else equal, MLPs should thus trade for a higher multiple since their cash flows are less burdened by taxes…. but it appears the market favors the simplicity and liquidity that comes with a C-Corp. Interestingly, we’re seeing MLPs respond by converting to C-Corps to try to get more liquidity / a higher multiple; in fact, there are only a handful of publicly traded MLPs that remain outstanding because most of them have converted to a C-corp to get a higher multiple or gotten taken private by a sponsor looking to capture that multiple arbitrage for themselves…. ok, the later is my opinion, not fact, but the former is definitely real; the slide below is similar to a slide most MLPs will publish when they announce a C-corp conversion:
Index stocks versus non-index stocks: this is an interesting one. I believe that stocks that are included in indices tend to trade for higher multiples than stocks outside of indices. We’ve all seen stocks pop when they get added to the S&P 500…. but remember, a stock that’s getting added to the S&P 500 was almost certainly included in a bunch of indices before that. I’m talking about at the extreme: stocks that are included in no indices (because of size, or free float, or perhaps a funky structure like MLPs I mentioned above) will be much less liquid and tend to trade for a much lower multiple than stocks that are included in some indices. So, that’s my believe…. but, curiously enough, I spent ~an hour googling and chatGPT’ing for academic papers to back that up, and couldn’t really find anything recent that backed up this point (nor did I see anything to refute it! I just couldn’t find anything except for this interesting paper that shows the pop from getting added to the S&P 500 has gone down a lot overtime3).
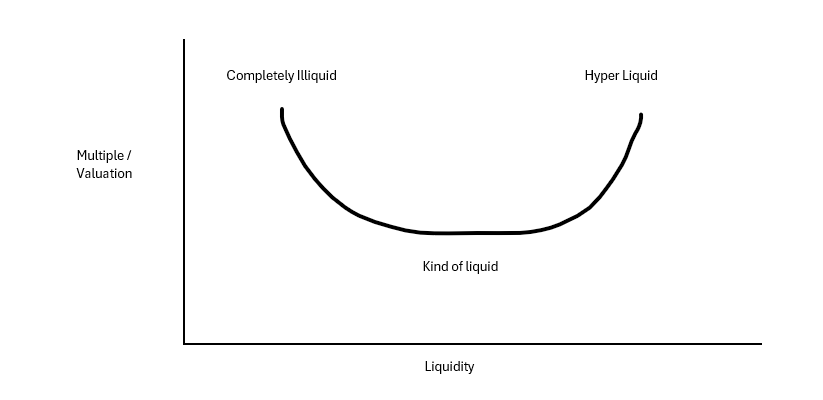
So I’d almost suggest there’s something of a smile curve going on here; I created a very ugly visible representation of it for fun:
In that chart, you can see stocks that are extremely liquid enjoy a premium multiple, while assets that are extremely illiquid (or, preferably, don’t trade at all, so effectively no liquidity) enjoy a premium because they can be “volatility laundered” / are so in demand from allocators. It’s assets in the middle that seem to suffer. These are assets that are liquid / publicly traded, but not so liquid that pod shops can trade in and out of them like water. Think smaller companies that are out of the indices, semi-controlled companies that only trade a few thousand shares a day, companies trading on smaller exchanges, companies with some restrictions on ownership (like MLPs mentioned above), etc. Across the board, those assets seem to trade for lower multiples and would probably get a boost if hey went fully illiquid (i.e. private) or liquid (i.e. took steps to improve their liquidity to get a multiple boost).
Ok, let’s turn to the second thought: Capex in the ground: where I think there’s a lot of market inefficiency currently.
A fellow investor / friend of mine and I were talking a few months ago about UK traded stocks. He said something along the lines of “it’s so shelled out over there, no one is willing to give companies any credit for growth investments. The stocks never start moving / reacting until growth investments are fully online and actually starting to show up in the income statement.”
I feel like something similar is happening in large swaths of the U.S. market today.
Let me be clear: I’m not saying it’s all stocks that are getting this treatment. If you’re looking at a stock that’s pumping tons of capex into some type of AI play, there’s a good chance the market is giving them a lot of credit for that capex.
But, outside of AI and a few other select growth areas, I think the most interesting place in the market is companies that have made large growth / capex investments over the last few years but have yet to see those investments impact their financials, because the market is often valuing the business only on the existing business and financials (and implicitly assuming all of that growth capex has functionally lit the money on fire).
Let me show you this point with an example: I have written two open letters to WOW’s special committee (disclosure: I am long WOW4). If I had to simplify the WOW story, it would be to this: WOW currently trades for ~5x trailing EBITDA. I think that’s too cheap for their assets, but for the sake of this story let’s just assume that’s the right multiple. However, WOW has invested ~$180m into growth capex (building fiber) over the past ~2 years, and it takes roughly 2 years for new build fiber to start producing positive EBITDA5. So, even if we assume that WOW’s core business is only worth 5x EBTIDA (and I disagree), that EBITDA number has almost nothing from all of that fiber build out! WOW’s market cap is ~$450m; giving no value to $180m in growth capex is a big, big black hole!
This “capex in the ground the market is assuming is worth nothing” is actually my favorite trend right now; I can think of 3-5 companies (including WOW) that have made big capex investments recently where the market is giving them almost no credit for the capex…. and, in many cases, the market continues to give them no credit even as you start to see signs that the capex is actually likely to prove to be an astute use of capital. Again, using WOW as an example, in the Q2 call the company noted, “we continue to make great progress with our fiber build in expansion markets, both in terms of passing new homes and increasing our penetration rate”, and you can comp WOW’s fiber penetration versus similar new builds and see that it’s tracking towards a success.
Why does that opportunity exist? I suspect it comes back to what the less efficient market paper talks about: markets have gotten really, really good at processing near term data points…. but as active and fundamental investors have gotten increasingly hollowed out, it’s more and more difficult for the market to properly evaluate and value investments that will take 3-5 years to play out.
Or at least that’s the story I’m telling myself! We’ll see how it plays out.
PS- as always, if you have any companies that you think fit well into my “made a big growth capex investment but market valuing the capex at zero” thesis…. well, I’d love to hear it / research it!
Ok I guess I don’t promise…. but I think it does!
Yes, that is n=1, but there are plenty of other examples of this relisting benefit playing out; I can’t tell you how many times I’ve dismissed an event driven pitch that centered on a company relisting to the U.S. and trading for a higher multiple only to watch in dismay as that exact thesis played out!
I’d guess this is in large part because of arbitrage; quant funds are better at guessing who is getting added to the S&P 500 and when, so they’ve bid up the stocks in advance of the add.
additional disclosure: WOW is undergoing a strategic review right now, and there’s a decent chance that by mentioning WOW over the weekend I am invoking Musk’s Razor and the strategic review ends without a deal Monday
That is the timeline LB partners mentioned in their 13-D, and it’s consistent with my industry understanding. As just one more data source, FYBR mentioned new build fiber taking 12-18 months to hit positive EBITDA.






You comment about capex and investment in the ground got me thinking about a comment from Opal fuels last earnings call:
"one of the beautiful things about our business is after we build these facilities, unlike a traditional energy company, we don't have to drill or spend capital to produce our fuel, right? If you remember what we do, we drop PVC pipes into landfills and they have perforations and we connect them all together, and we apply a little bit of suction to gather all that gas to our facilities. And the facilities themselves, if you look across the portfolio where it sits today, it's in the single-digit millions of maintenance CapEx, and these are 20-25-year assets, and some of our gas rights even go out longer.
So when you really think about us and the valuation of OPAL Fuels, our discretionary free cash flow after we build these facilities is really pretty phenomenal. And that discretionary free cash flow can be used to invest in new projects and that's what we're doing today because we still see really attractive opportunities to grow the business. And in the future, you've got other things you could be doing with that discretionary free cash flow, you could make acquisitions, you could pay a really healthy dividend. There's all sorts of things that we think can be a powerful shareholder value driving tool. And I think we're going to get back into that and start illustrating to folks not only is this really -- are we growing extraordinarily quickly from an adjusted EBITDA perspective, but that adjusted EBITDA translates into discretionary free cash flow to enhance shareholder value."
I wonder if RNG can be a thing given the D3 RIN pricing and possible leverage to nat gas prices.
My favorite thesis right now is the same as the one detailed here, but with one twist: I think the ports and air cargo operators in Vietnam are not pricing in just how massive the capex investments that other companies are making and have recently made in the country.
As these factories continue to come online, and as the products they produce make their way out of the country, these businesses (which already boast roughly 70% net profit margins) are going to absolutely gush money and, if history is any guide, pay most all of it back to shareholders right away.